Research Article | | Peer-Reviewed

Improved Correlation Models for Optimum Moisture Content Based on Atterberg Limits

Received: 11 August 2025     Accepted: 25 August 2025     Published: 10 October 2025
Views:       Downloads:
Abstract

The compaction characteristics of soil are fundamental to the stability and performance of a wide range of geotechnical engineering applications. Compaction, a mechanical process involving the application of energy to increase soil density, fulfills multiple essential purposes: minimizing structural settlement under load, reducing soil permeability to mitigate liquefaction risks, and enhancing shear strength. It is particularly vital in hydraulic structures such as dams, where water retention is essential. However, conducting standard laboratory compaction tests, such as the Proctor test, is often expensive and time-consuming. In contrast, the determination of Atterberg limits, namely Liquid Limit (LL), Plastic Limit (PL), and Plasticity Index (PI) is relatively quick, simple, and cost-effective. Establishing correlations between these Atterberg limits and compaction characteristics, particularly Optimum Moisture Content (OMC), may offer a practical alternative for predicting compaction behavior. This study investigates such correlations using five types of fine-grained clay soils collected from various locations within the Rajshahi Division of Bangladesh. Through regression analysis, four predictive relationships between OMC and the Atterberg limits are proposed, highlighting the potential to estimate OMC without relying solely on traditional compaction tests.

Published in American Journal of Civil Engineering (Volume 13, Issue 5)
DOI 10.11648/j.ajce.20251305.11
Page(s) 257-264
Creative Commons

This is an Open Access article, distributed under the terms of the Creative Commons Attribution 4.0 International License (http://creativecommons.org/licenses/by/4.0/), which permits unrestricted use, distribution and reproduction in any medium or format, provided the original work is properly cited.

Copyright

Copyright © The Author(s), 2025. Published by Science Publishing Group

Keywords

Atterberg Limits, Compaction, Fine Grained Soil, Optimum Moisture Content, Proctor Test, Specific Gravity

1. Introduction
Soil compaction is the process of applying mechanical energy to densify soil by reducing air voids . This reduction in void ratio decreases the soil’s permeability, making it less prone to water flow, which is an essential property for soils used in water-retaining structures such as earthen dams. Compaction characteristics are influenced by several factors, including soil type, the degree and method of compaction, and the moisture content at the time of compaction.
In field applications, determining the optimum moisture content (OMC) is essential to ensure proper compaction. These parameters are typically obtained in the laboratory using the Standard Proctor Test . Establishing OMC is a critical step prior to any construction activity involving earthworks.
The Atterberg limits, namely the liquid limit, plastic limit, and plasticity index, describe the consistency and plasticity of fine-grained soils. Since soil plasticity characteristics are closely related to moisture behavior, a potential relationship may exist between the Atterberg limits and the optimum moisture content. Direct laboratory determination of compaction characteristics can be time-consuming and labor-intensive. Therefore, developing reliable correlations between Atterberg limits and OMC could reduce the number of required tests, thereby saving both time and resources in geotechnical investigations .
Previous studies have examined the relationship between compaction characteristics, particularly optimum moisture content (OMC), and the liquid limit (LL) and plastic limit (PL) . Findings from these works generally suggest that OMC increases as LL and PL increase, although the strength of the correlations and the degree of data variability differed across studies. In contrast, Sridharan and Nagaraj (2005) reported that OMC does not correlate well with LL, but shows a better correlation with PL . Similarly, Hama Ali et al. (2019) found that neither LL nor PL provided a satisfactory correlation with OMC . In 2022, Yousif and Mohamed developed regression models to predict OMC of fine-grained soils from Atterberg limits using data from the Upper Atbara Dam project, reporting the highest correlation with LL and the weakest with PI, with values below 0.90 . Later in 2023, Mouloud and Hassan examined OMC correlations with LL and PL for clayey soils from the University of Diyala, finding relatively weak fits with values of 0.48 and 0.69, respectively . Recently in 2025, Woldesenbet et al. developed numerical models to predict OMC of lateritic soils from index properties, reporting strong correlations with LL, PL, and PI individually, but without combining all Atterberg limits in a single predictive model . These studies highlight the limitations of previous approaches, which often yielded relatively low values and did not incorporate all Atterberg limits together in a unified predictive framework for OMC.
To address the above research gaps, this study investigates the relationships between the compaction characteristics of soil samples collected from various locations in Rajshahi and their Atterberg limits, incorporating all relevant parameters (LL, PL, PI, and specific gravity (Gs)) to achieve higher coefficients of determination for improved predictive accuracy. The research was conducted in three main stages. First, grain size distribution and index properties were determined to characterize the soils. Second, Standard Proctor compaction tests were performed to establish their compaction characteristics. Finally, correlations between OMC and LL, PL, PI, and Gs were developed and validated against the experimental results.
2. Materials and Methods
A set of five soil samples were collected from different parts such as Godagari (Sample G), Kedur mor (Sample K), Bulonpur (Sample B), Rajabari (Sample R), Aliganj (Sample A) of Rajshahi division of Bangladesh. The samples were natural soil and locally available. The samples were collected from a depth of about 5 ft below the natural ground surface. The locations are shown in Figure 1. They are fine grained in properties. Then the soil is tested for Specific gravity, Grain size analysis, Atterberg limit and Standard Compaction test. Different relations are plotted with different parameters from the test data and shown the comparative relationships with one another to find their behavior. Some equations are formed relating with these parameters through regression analysis. Then these equations are checked and validated with several original soil test data.
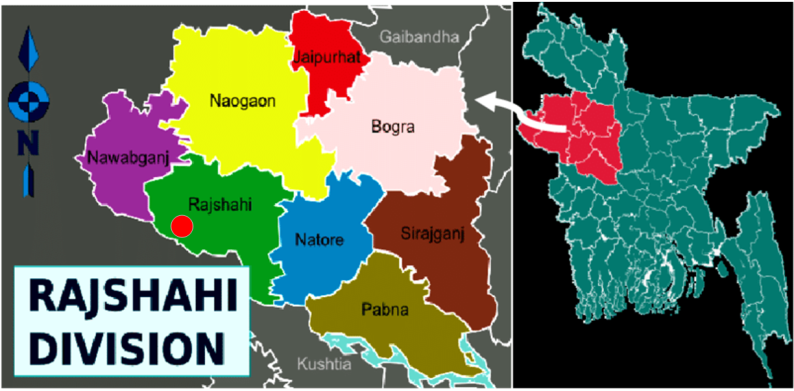
Figure 1. Soil sample collection location (indicated as a red circle on the Rajshahi division of Bangladesh. The map is collected from reference .
3. Results
Four laboratory experiments have been performed during this entire process. Experimental results are illustrated in the following sub-sections.
3.1. Grain Size Analysis
Grain size analysis of five soil samples was conducted using both sieve analysis and the hydrometer test. For the sieve analysis, 300 grams of each soil sample were used, and the portion passing through the # 200 sieve was subsequently subjected to the hydrometer test. In the hydrometer test, sodium hexametaphosphate was employed as the dispersing agent. The entire particle size analysis was performed in accordance with ASTM D422.
By combining the results of both tests, the particle size distribution (gradation) curves were generated, as shown in Figure 2. The percentages of gravel, sand, silt, and clay for each sample are demonstrated in Table 1.
Table 1. Grain Size Distribution of Soil Samples Based on Sieve and Hydrometer Analysis.

Sample

Gravel (%)

Sand (%)

Silt (%)

Clay (%)

G

1.77

8.23

40.1

49.9

K

0.46

6.47

38.73

54.35

B

1.77

8.74

37.24

52.26

R

1.12

8.2

18.56

72.12

A

0.35

1.75

34.35

63.55

Based on these results and following the USDA soil classification system, Sample G was classified as silty clay, while Samples K, B, R, and A were classified as clay.
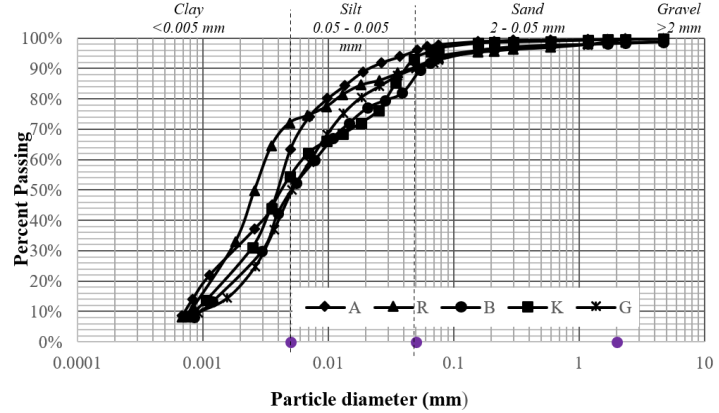
Figure 2. Gradation curves of different soils.
3.2. Specific Gravity Test
The specific gravity of five soil samples was determined using a pycnometer, following the procedure outlined in ASTM D854. In each case, 10 grams of oven-dried soil passing through #40 sieve was placed into the pycnometer. The measurements were carried out carefully to ensure accuracy. The results of the specific gravity tests are summarized in Table 2.
Table 2. Specific gravity of five soil samples.

Sample name

Specific gravity (Gs)

G

2.69

K

2.70

B

2.69

R

2.71

A

2.71

3.3. Compaction Test (Standard Proctor Test)
The optimum moisture content (OMC) of the five soil samples was determined using the Standard Proctor Test in accordance with ASTM D698. In this experiment, 3.5 kg of soil, passing through #4 sieve, was compacted in three layers at varying moisture contents. The dry density was recorded for each moisture content, and the corresponding compaction curves are shown in Figure 3.
From Figure 3, it can be observed that Sample G exhibited an optimum moisture content of 17.1% and a maximum dry density (MDD) of 1.66 g/cc. For Sample K, the OMC was 17.8% and the MDD was 1.86 g/cc, while Sample B showed an OMC of 18.1% and an MDD of 1.71 g/cc. Sample R had an OMC of 20.1% and an MDD of 1.99 g/cc, whereas Sample A demonstrated an OMC of 21.1% and an MDD of 1.96 g/cc.
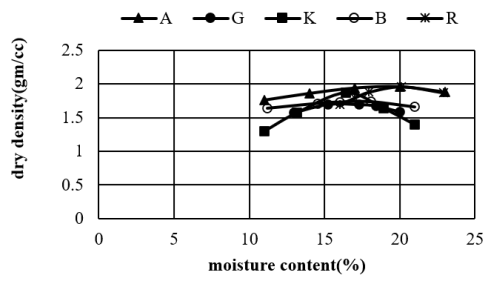
Figure 3. Dry density Vs Moisture content.
3.4. Atterberg Limit Test
The liquid limit (LL) and plastic limit (PL) of the five soil samples were determined using the Atterberg limit test, following the procedure outlined in ASTM D4318. In this experiment, 120 grams of soil, passing through # 40 sieve, was used. The liquid limit was measured using the Casagrande apparatus.
According to the Plasticity Chart, soils with a liquid limit less than 50 and a plasticity index (PI) greater than 7 are classified as inorganic clay of medium to low plasticity (CL). Soils with a liquid limit greater than 50 and a PI on or above the A-line are classified as inorganic clay of high plasticity (CH). The combined results of all tests, along with the USCS soil classifications, are summarized in Table 3.
Table 3. Combined results of all experiments with USCS classification of soil.

Sample name

Soil type

LL (%)

PL (%)

PI (%)

Gs

G

CL

30.6

23.6

7.0

2.70

K

CL

28.5

21.4

7.1

2.69

B

CL

28.8

21.6

7.2

2.69

R

CH

51.1

27.9

23.2

2.71

A

CH

50.9

20.2

30.7

2.71

3.5. Correlation Between OMC and LL
When the optimum moisture content (OMC) was plotted against the liquid limit (LL), the relationship was found to be nonlinear, as depicted in Figure 4. The data points form a curved trend, indicating that LL alone is not a strong linear predictor of OMC across the tested samples.
To enhance the predictive relationship, the ratio of LL to PL (liquid limit to plastic limit) was introduced. As shown in Figure 5, plotting OMC against LL/PL yielded a strong linear correlation. A linear regression analysis produced the equation:
OMC=3LL/PL+14(1)
with a coefficient of determination of R² = 0.9223, indicating a very strong fit between the variables.
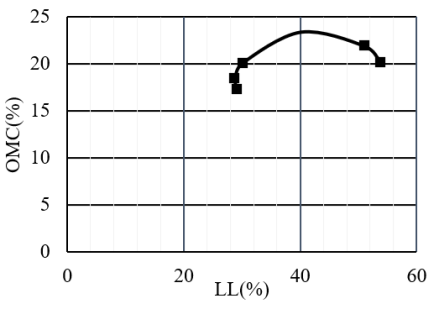
Figure 4. Optimum moisture content vs liquid limit.
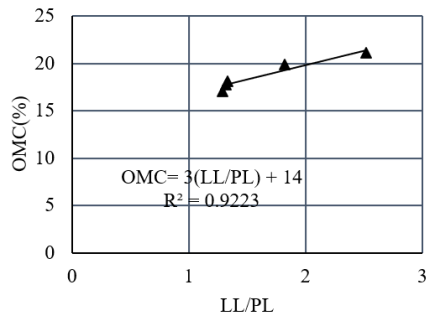
Figure 5. Optimum moisture content vs Liquid limit/Plastic limit.
3.6. Correlation Between OMC and PL
When the optimum moisture content (OMC) was plotted against the plastic limit (PL), the relationship appeared nonlinear, as shown in Figure 6. The data trend suggests that PL alone does not exhibit a strong linear correlation with OMC across the samples.
To improve the correlation, the ratio of PL to LL (plastic limit to liquid limit) was used instead. As depicted in Figure 7, this transformation resulted in a strong negative linear relationship. A linear regression analysis yielded the equation:
OMC=-9.8PL/LL+25(2)
with a coefficient of determination of R² = 0.9691, indicating an excellent fit. This suggests that the PL/LL ratio serves as a reliable predictor of OMC for the tested soils, capturing the effect of plasticity more effectively than PL alone.
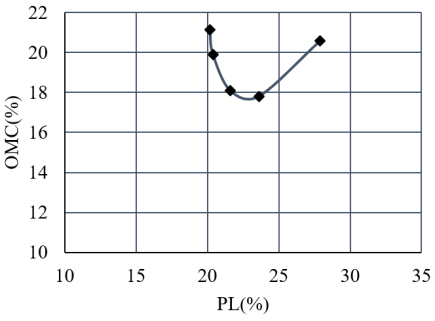
Figure 6. Optimum moisture content vs plastic limit.
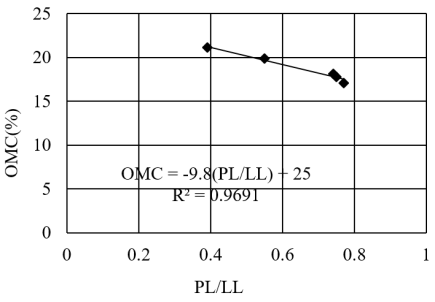
Figure 7. Optimum moisture content Vs Plastic Limit/ Liquid Limit.
3.7. Correlation Between OMC and PI
The relationship between optimum moisture content (OMC) and the plasticity index (PI) was initially found to be nonlinear, as illustrated in Figure 8. The curve suggests that PI alone does not strongly predict OMC across all soil types considered.
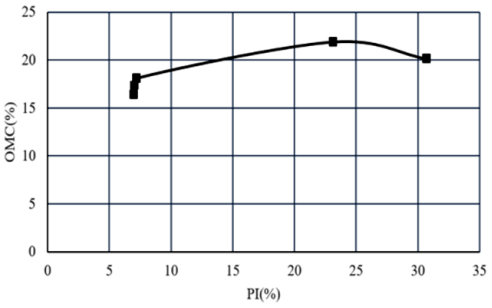
Figure 8. Optimum moisture content vs Plasticity index.
To improve the correlation, two normalization approaches were considered. In the first approach, the plasticity index was divided by the plastic limit (PL) to form a dimensionless ratio. In the second approach, the plasticity index was divided by the specific gravity (Gs) of the soil.
As shown in Figure 9, plotting the optimum moisture content (OMC) against the PI/PL ratio produced a linear relationship, described by the equation:
OMC=3PI/PL+17(3)
with a coefficient of determination of R2=0.9059, indicating a strong positive fit. This suggests that the PI/PL ratio is an effective predictor of OMC, reflecting the influence of both plasticity and moisture retention characteristics in fine-grained soils.
Similarly, when the plasticity index was normalized by the specific gravity (Gs) and plotted against OMC, a stronger linear trend was observed, as presented in Figure 10. The regression equation is:
OMC=0.4PI/Gs+17(4)
with a coefficient of determination of R2=0.9535 indicating an excellent fit. This demonstrates that the PI/Gs ratio is a highly reliable predictor of OMC, as it incorporates both plasticity and soil density effects, offering a more comprehensive representation of compaction behavior.
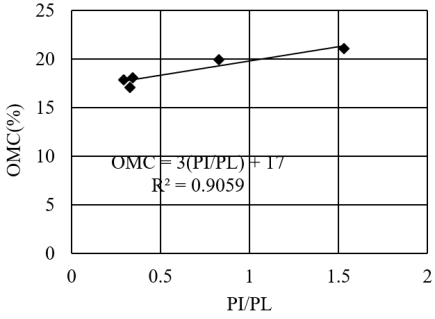
Figure 9. Optimum moisture content Vs Plasticity index/Plastic Limit.
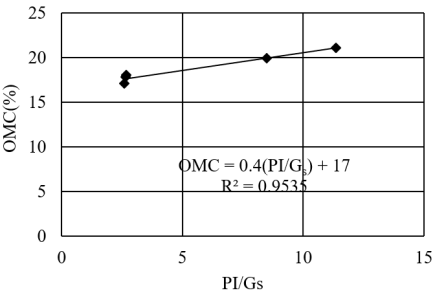
Figure 10. Optimum moisture content vs Plasticity index/ specific gravity.
Based on the regression analyses presented in Figures 5 through 10, four empirical equations were developed to estimate the optimum moisture content (OMC) using different combinations of Atterberg limits and specific gravity. These equations are referred to as Equations (1)-(4). Due to the limited dataset, detailed standard errors and confidence intervals were not computed, and the regression is presented with its coefficients and value only.
These equations show that using normalized forms of Atterberg limits improves the prediction of optimum moisture content. All four models produced coefficients of determination greater than 0.90, indicating strong correlations between the predicted and measured values. Among them, the equations based on the PL/LL and PI/Gs ratios yielded the highest coefficients of determination, representing the best fit to the experimental data. These results can be applied to estimate optimum moisture content when direct Standard Proctor Test measurements are not available.
The accuracy of the developed equations was verified by comparing the OMC values obtained from the Standard Proctor Test with those predicted using Equations (1) to (4).
The comparison is presented in Table 4, which shows that the predicted values from all four models are in close agreement with the experimental results. The differences between measured and calculated OMC values are generally small, indicating that each equation provides a reliable estimation. The equations based on the PL/LL and PI/Gs ratios, which demonstrated the highest coefficients of determination, also showed the closest match to the test results, further confirming their predictive capability.
Table 4. Variation of obtained value of optimum moisture content from equations with test results.

OMC from test (%)

OMC from eqn. (1) (%)

OMC from eqn. (2) (%)

OMC from eqn. (3) (%)

OMC from eqn. (4) (%)

17.1

17.9

17.4

17.8

18.0

17.8

17.9

17.6

17.9

18.1

18.1

18.0

17.7

18.0

18.2

20.1

19.5

19.6

19.5

20.4

21.1

21.5

21.1

21.6

21.5

Table 5. Verifying the obtained empirical formulas using experimental data of others.

Experimental result of others

Derived empirical formula to verify experimental data

Reference

LL (%)

PL (%)

PI (%)

GS

OMC (%)

OMC = 3(LL/PL)+14

OMC = -9.8(PI/Gs)+25

OMC = 3(PI/PL)+17

OMC = 0.4(PI/GS)+17

Sridharan and Nagaraj (2005)

48

21.3

27.6

2.69

21.2

20.8

20.7

20.9

21.1

Jyothirmayi. et al (2015)

58.1

29.9

28.2

2.71

21.4

19.8

20.0

19.8

21.2

Tsegaye, et al (2017)

60

25

35

2.74

22

21.2

20.9

21.2

22.1

Yousif & Mohamed (2022)

49.00

19.00

30.00

2.70

21.00

21.74

21.20

21.74

21.44

Mouloud & Hassan (2023)

27.60

20.40

7.20

2.67

18.00

18.06

17.76

18.06

18.08

4. Discussion
To evaluate the applicability of the proposed empirical equations, their performance was tested against experimental data reported by other researchers, as presented in Table 5. The comparison shows that the OMC values predicted by the derived formulas are generally in close agreement with those obtained from laboratory testing. In most cases, the differences between predicted and measured values remain small, demonstrating that the equations effectively capture the relationship between compaction characteristics and Atterberg limits across a variety of soil types. The PL/LL ratio captures relative plasticity behavior linked to moisture sensitivity, while PI normalized by Gs integrates both plasticity and soil density, hence better reflecting compaction behavior. Minor discrepancies can be attributed to natural variations in soil composition, differences in sample preparation, and variations in testing procedures between studies. Overall, the low error range indicates that the equations provide a reliable means of estimating OMC, offering a practical alternative in situations where direct laboratory testing is not feasible.
Given their demonstrated accuracy and consistency across independent datasets, the proposed equations can be applied with a high degree of reliability for predicting OMC in engineering practice, thereby forming the basis for the conclusions drawn in this study.
5. Conclusions
The regression analysis produced four empirical equations linking optimum moisture content (OMC) with combinations of Atterberg limits and specific gravity. All models showed strong agreement with experimental values, with two equations achieving the highest coefficients of determination. The close match between predicted and measured OMC confirms that the proposed formulations can reliably estimate OMC over a range of soil plasticity conditions.
While the results are promising, the study has limitations due to the relatively small dataset (five soil samples) and the regional focus on soils from the Rajshahi Division of Bangladesh. Therefore, the equations are best considered as preliminary models, suitable for early-stage site investigations where approximate predictions are sufficient. Future research should incorporate larger datasets, a wider variety of soil types, and more advanced statistical approaches to further validate and refine the proposed correlations.
Despite these limitations, the proposed method offers a practical means of estimating compaction characteristics when direct testing is not feasible. Since the required parameters are routinely determined in standard soil classification tests, the approach can save both time and resources while maintaining reasonable accuracy. This makes it useful in preliminary site investigations and early design stages of geotechnical projects.
Acknowledgments
The authors acknowledge the support through providing laboratory facilities by the department of civil Engineering, Rajshahi University of Engineering & Technology, Rajshahi, Bangladesh.
Author Contributions
Mahmuda Khanom: Conceptualization, Data curation, Investigation, Methodology, Validation, Writing - original draft
Md. Abdul Alim: Supervision, Writing - review & editing
Funding
This work is not supported by any external funding.
Data Availability Statement
The data is available from the corresponding author upon reasonable request.
Conflicts of Interest
The authors declare no conflicts of interest.
References
[1] Woldesenbet, T. T., Petros, T., Rabba, Z. A. and Quezon, E. T. Developing a numerical models to predict moisture-density relationship from the index properties of lateritic soils, Indian Geotechnical Journal. 2025, 55(2), 827-44.
[2] Budhu, M. Soil. Mech.&. Fund. 1st ed., United Kingdom, John Wiley and Sons; 2015, p 373.
[3] Verma G, Kumar B. Prediction of compaction parameters for fine-grained and coarse-grained soils: a review, International Journal of Geotechnical Engineering. 2020, 14(8), 970-977.
[4] Daniel D. E, Benson C. H. Water content-density criteria for compacted soil liners, Journal of Geotechnical Engineering. 1990, 116(12), 1811-30.
[5] Gurtug, Y., & Sridharan, A. Compaction behaviour and prediction of its characteristics of fine grained soils with particular reference to compaction energy, Soils and foundations, 2004, 44(5), 27-36.
[6] Saikia, A., Baruah, D., Das, K., Rabha, H. J., Dutta, A., and Saharia, A. Predicting compaction characteristics of fine-grained soils in terms of Atterberg limits, International Journal of Geosynthetics and Ground Engineering, 2017, 3(18), 2-9. doi:
[7] Sridharan, A., and Nagaraj, H. B. Plastic limit and compaction characteristics of fine-grained soils, Ground Improvement, 2005, 9(1), 17-22.
[8] Hama A. H. F., Hama R. A. J., Hama K. M. I., and Muhedin, D. A. A Correlation between Compaction Characteristics and Soil Index Properties for Fine-grained Soils, Polytechnic Journal, 2019, 9(2), 93–99.
[9] Yousif, A. A. A., and Mohamed, I. A. Prediction of Compaction Parameters from Soil Index Properties Case Study: Dam Complex of Upper Atbara Project, American Journal of Pure and Applied Sciences, 2022, 4(1), 1–9.
[10] Mouloud, A. M., and Hassan, A. A. Application of Atterberg Limits for Predicting Soil Compaction Characteristics, Academic Science Journal, 2023, 1(3), 1–13.
[11] Jyothirmayi, K. H., Gnanananda, T., and Suresh, K. Prediction of compaction characteristics of soil using plastic limit, International Journal of Research in Engineering and Technology (IJRET), 2015, 4(6), 253–256.
[12] Tsegaye, T., Fikre, H., and Abebe, T. Correlation between compaction characteristics and Atterberg limits of fine-grained soil found in Addis Ababa, International Journal of Scientific & Engineering Research (IJSER), 2017, 8(6), 357–362.
[13] Rahman, N., Rahman, S., Ahmed, S. O., Gafur, A. M. R. An Analysis of Existing Condition & Potentiality of Mango Based Industries in Rajshahi Division. In International Conference on Planning, Architecture and Civil Engineering, 2017, Rajshahi University of Engineering & Technology, Rajshahi, Bangladesh.
Cite This Article
  • APA Style

    Khanom, M., Alim, M. A. (2025). Improved Correlation Models for Optimum Moisture Content Based on Atterberg Limits. American Journal of Civil Engineering, 13(5), 257-264. https://doi.org/10.11648/j.ajce.20251305.11

    Copy | Download

    ACS Style

    Khanom, M.; Alim, M. A. Improved Correlation Models for Optimum Moisture Content Based on Atterberg Limits. Am. J. Civ. Eng. 2025, 13(5), 257-264. doi: 10.11648/j.ajce.20251305.11

    Copy | Download

    AMA Style

    Khanom M, Alim MA. Improved Correlation Models for Optimum Moisture Content Based on Atterberg Limits. Am J Civ Eng. 2025;13(5):257-264. doi: 10.11648/j.ajce.20251305.11

    Copy | Download

  • @article{10.11648/j.ajce.20251305.11,
      author = {Mahmuda Khanom and Md. Abdul Alim},
      title = {Improved Correlation Models for Optimum Moisture Content Based on Atterberg Limits
    },
      journal = {American Journal of Civil Engineering},
      volume = {13},
      number = {5},
      pages = {257-264},
      doi = {10.11648/j.ajce.20251305.11},
      url = {https://doi.org/10.11648/j.ajce.20251305.11},
      eprint = {https://article.sciencepublishinggroup.com/pdf/10.11648.j.ajce.20251305.11},
      abstract = {The compaction characteristics of soil are fundamental to the stability and performance of a wide range of geotechnical engineering applications. Compaction, a mechanical process involving the application of energy to increase soil density, fulfills multiple essential purposes: minimizing structural settlement under load, reducing soil permeability to mitigate liquefaction risks, and enhancing shear strength. It is particularly vital in hydraulic structures such as dams, where water retention is essential. However, conducting standard laboratory compaction tests, such as the Proctor test, is often expensive and time-consuming. In contrast, the determination of Atterberg limits, namely Liquid Limit (LL), Plastic Limit (PL), and Plasticity Index (PI) is relatively quick, simple, and cost-effective. Establishing correlations between these Atterberg limits and compaction characteristics, particularly Optimum Moisture Content (OMC), may offer a practical alternative for predicting compaction behavior. This study investigates such correlations using five types of fine-grained clay soils collected from various locations within the Rajshahi Division of Bangladesh. Through regression analysis, four predictive relationships between OMC and the Atterberg limits are proposed, highlighting the potential to estimate OMC without relying solely on traditional compaction tests.
    },
     year = {2025}
    }
    

    Copy | Download

  • TY  - JOUR
    T1  - Improved Correlation Models for Optimum Moisture Content Based on Atterberg Limits
    
    AU  - Mahmuda Khanom
    AU  - Md. Abdul Alim
    Y1  - 2025/10/10
    PY  - 2025
    N1  - https://doi.org/10.11648/j.ajce.20251305.11
    DO  - 10.11648/j.ajce.20251305.11
    T2  - American Journal of Civil Engineering
    JF  - American Journal of Civil Engineering
    JO  - American Journal of Civil Engineering
    SP  - 257
    EP  - 264
    PB  - Science Publishing Group
    SN  - 2330-8737
    UR  - https://doi.org/10.11648/j.ajce.20251305.11
    AB  - The compaction characteristics of soil are fundamental to the stability and performance of a wide range of geotechnical engineering applications. Compaction, a mechanical process involving the application of energy to increase soil density, fulfills multiple essential purposes: minimizing structural settlement under load, reducing soil permeability to mitigate liquefaction risks, and enhancing shear strength. It is particularly vital in hydraulic structures such as dams, where water retention is essential. However, conducting standard laboratory compaction tests, such as the Proctor test, is often expensive and time-consuming. In contrast, the determination of Atterberg limits, namely Liquid Limit (LL), Plastic Limit (PL), and Plasticity Index (PI) is relatively quick, simple, and cost-effective. Establishing correlations between these Atterberg limits and compaction characteristics, particularly Optimum Moisture Content (OMC), may offer a practical alternative for predicting compaction behavior. This study investigates such correlations using five types of fine-grained clay soils collected from various locations within the Rajshahi Division of Bangladesh. Through regression analysis, four predictive relationships between OMC and the Atterberg limits are proposed, highlighting the potential to estimate OMC without relying solely on traditional compaction tests.
    
    VL  - 13
    IS  - 5
    ER  - 

    Copy | Download

Author Information
  • Abstract
  • Keywords
  • Document Sections

    1. 1. Introduction
    2. 2. Materials and Methods
    3. 3. Results
    4. 4. Discussion
    5. 5. Conclusions
    Show Full Outline
  • Acknowledgments
  • Funding
  • Data Availability Statement
  • Conflicts of Interest
  • References
  • Cite This Article
  • Author Information